Building a Dataset
This guide will cover how to build out a dataset and the different Functions and Formatting options available during the process.
Start by adding a new Dataset
- Click "Dynamic Reporting" under the Reports tab
- Click "Manage Datasets" in the "Manage Datasets" box on the left side of the page
- At the top of the listing of available datasets, click the table icon that shows a green plus sign
Step 1: "Dataset Information"
- Set the name of the dataset
- This name must be unique to the other datasets
- Name the dataset something descriptive so you have an idea of what kind of information is included just by looking at the name
- Add a description of the dataset
- This description is required
- The description allows you to give more detail about the dataset than you are able to give in the shorter title
- The "Created By" field displays your username to show who is the creator of the dataset
- The "Distinct" check box will remove duplicate records from the dataset if checked
- This option is useful if you are trying to build a dataset that has duplicate records and you need only one record for each value
- Example: a listing of years where applications were filled out
- This option is useful if you are trying to build a dataset that has duplicate records and you need only one record for each value
- The Share level option will allow you to choose who is able to view this dataset
- Private: Only the creator
- Group: Shows a multi-select check box to allow you to choose which employee groups are able to view the dataset
- Other Users: Everyone with a valid account
- Public: Everyone with access
- The "Overwrite" option will allow you to overwrite an existing dataset with the version that you are going to create
- When a dataset is included in a report or another dataset, this option will be unavailable since changing the dataset may break the report or dataset that depends on it
Step 2: "Data Tables"
This step allows you to choose which tables you want to bring into the dataset. This includes the other datasets that show on the "Manage Dataset" page. You can click on the name of the table or dataset to add it to the listing of tables you want to use. Once it is added to the list, the table will appear on the right side of the page and you will have several options available to manage that table:
- Remove: If you added the table by accident, you can remove it by clicking the red "X" to the left of the table name.
- View: To view the contents to the table before you move to the next step, you can click the table icon to the left of the table name. This will load the contents of that table into a new tab in your browser.
- Rename: In the text box to the right of the table name, you can choose a different name for that table to appear by in the dataset. This is helpful if the original name of the table is longer and you want to simplify it. This is also helpful if the table name is vague and you want to give more detail.
Step 3: "Join Tables"
This step is where you link up the tables and specify what fields to join the tables on. By joining the tables together on a common field, the dataset is able to tell which information belongs to which record so that when you choose fields to display, the dataset will create a row for information that belongs together. This is the step where knowing what the Primary and Foreign keys of the table will be necessary in order to build an accurate and functional dataset.
Using the Table Relations page of Customizer
OneGov includes a very powerful resource for finding Primary and Foreign keys in a table. View the guide to learn how to use this resource.
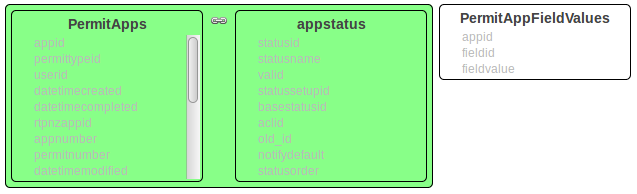
On the Join step, the tables that you selected on the previous step will all be shown in the top part of the page. When joining multiple tables, it is typically a good idea to start with a "base" table. This would be a table that contains the most general information that you want to include in the dataset. For example, if I want to build a dataset that includes information about all the permits in the site, I would include the PermitApps table and use that as my "base" table since that table includes all permits no matter which type or what status it is in. You can always trim down what information is included in a dataset but can sometimes be difficult to add more information in to a more focused dataset.
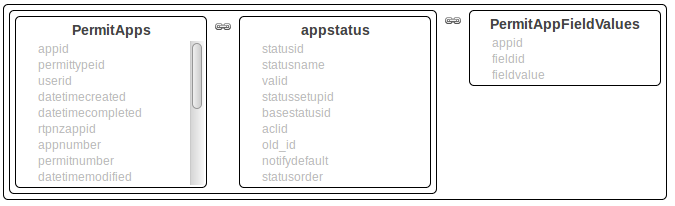
When choosing tables to join, a visual aid is used to help show what table is currently selected. When hovering over the available tables, they will turn a soft green. When you click on a table to select it for joining, it will initially turn red. When you move the mouse off of the table, it will change from red to a bright green. The red indicates that you cannot join the table to the one you have currently selected (you can't join a table to itself) and the bright green indicates which table you have currently selected. When you hover over another un-joined table, it will turn a soft green to indicate that you can select that table to join. NOTE: It is important to note that just because the dataset creation tool allows you to select two tables to join it doesn't mean that those two tables will have a common field to join on. Once you have two tables joined together a box will appear around those two tables and an icon of a chain will appear between those two tables to indicate that they are linked.

Once the tables have been joined, the fields to join those tables on will need to be selected. This is done using the section that appears below the joined tables.

There are four different options available to choose from in the drop down. For this example, we will assume that I am joining the permitappfieldcustomoptions table (which is used to join the PermitApps and parcel records table) and the parcel records table. Depending on the option that is chosen in the drop down, there will be different information pulled into the dataset
| Only matching records | If "Only matching records" is chosen, the dataset will only display applications that have a parcel record associated with it. | 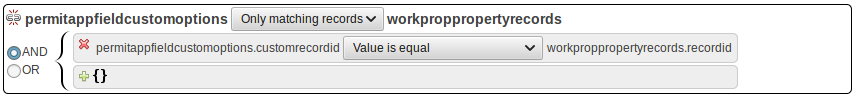 |
| ||||||||||
|---|---|---|---|---|---|---|---|---|---|---|---|---|---|
| All from left | If "All from left" is chosen, the dataset will display all applications whether or not they have a parcel number associated with it. |
|
| ||||||||||
| All from right | If "All from right" is chosen, the dataset will display all parcels whether or not they have an application associated with it. |  |
| ||||||||||
| All records | If "All records" is chosen, the dataset will display all applications and all parcels | 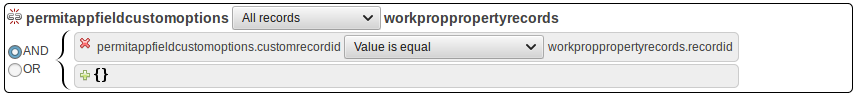 |
|

Once you have chosen one of the options from the drop down, you can choose which fields from each table to make the join on. When you first click the green plus symbol, it will default to joining the tables where a certain value in the table on the left of the join is not blank.

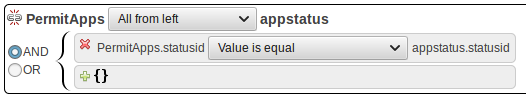
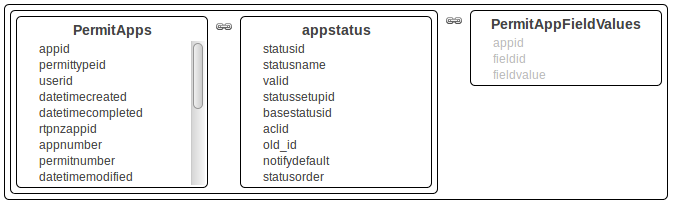
There are a number of different options for joining tables and the most commonly used one is "Value is equal". By choosing this option, you can choose columns in the tables that are a primary and foreign key. For example, in the PermitApps table, there is a column called statusid. This column is also in the appstatus table and follows the id naming convention so it can be inferred that this is a Primary/Foreign key pairing. To set up this join on those two fields, click on one of the red boxes with a question mark inside to specify which side of the join to start on. In this case, I am starting with the left side.

Because I chose to set the left side first, my choices for which fields I am able to put in this position are restricted to the table on the left.

Once I have both of the fields filled in the join, my join is complete.
Most datasets that are created involve more than two tables. To join a third table to the other two, the process is the same with the only difference being that the already joined tables effectively act as a single table. For example, when you click on the two joined tables to start the join, they both change to the bright green color to indicate that they are currently selected.
Once you click the third table, the tables will display that they are now linked and another joining section will appear below the first one.

Another difference is now when you choose a field to join on the left side, all of the tables to left of the new table are available to be used for the join. This is helpful because the PermitAppFieldValues table doesn't have a field that we can join on but PermitApps does with the appid field.
You can join as many tables as you need in a dataset but keep in mind that the more fields you include in a single dataset, the longer it will take to load and if it is large enough, it won't load at all.
Step 4: "Fields"
This step is where you start to add fields to the dataset. On the top half of the page, you will see all of the tables (and their respective fields) that you have chosen to include in the dataset on step 2. You can add fields one-by-one by clicking on the name of the field from the list of field names. You can also choose all of the fields from a table by clicking the icon to the left of the table name. The fields added on this step will be displayed exactly as they are in the original table, without formatting or other alterations.
Once the fields are added there are two options available for that field:
- Remove: If you added the field by accident, you can remove it by clicking the red "X" to the left of the field name.
- Rename: In the text box to the right of the field name, you can choose a different name for that table to appear by in the dataset. This is helpful if the original name of the field is long or vague.
Map Reports
If you are creating a map report, be sure to include the Geometry column from the PermitApps table in the fields section. If the Geometry column is empty but you do have a map on the application, please contact support through the service desk link in the top right corner of the site.
Step 5: "Formulas"
This step allows you to add fields to the dataset and format them to display differently than they do in the original table. This step includes mathematical operations, and date formatting.
Creating a formula
A formula is created by clicking the red box with the question mark inside it (which will turn shaded when clicked) and then choosing a formula from the list labeled "Operations". Once chosen, the shaded box will change to reflect the inputs needed for that particular formula. For example, if you choose "Add", the shaded box will turn into two shaded boxes separated by a plus sign to show that for this operation, you need to provide two values to add together.

If you wanted to add three values together, you can click one of the two boxes in the formula so that only a single box is shaded and click the "Add" formula again.

Now the the formula has been changed to three boxes with plus signs separating them. Mathematical formulas will follow Order of Operations.

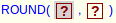
Certain parts of formulas are not able to have other formulas inserted into them like the addition is. For example, if you choose the "Round" formula and click the second of the two boxes, you should notice that you aren't able to choose any operations or table fields to insert in that spot. This is because you have to use the "Manual Entry" box to insert a number. This is done by typing a value into the text box and then clicking the equals sign to the left of the text box to insert the value into the formula.
| Operation | Use | Requirements | Operation Format |
|---|---|---|---|
| Absolute | Returns the absolute value of the supplied field | A field containing numeric data |
|
Add | Returns the result of two numeric values added together | Two fields containing numeric data |
|
| Average | Returns the average of a field | A field containing numeric data |
|
| Ceiling | Returns the nearest integer greater than or equal to the provided numeric field | A field containing numeric data |
|
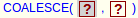
| Coalesce | Returns the value of the first field in the listing that isn't null/empty | At least two fields |
|
| Count | Returns a number count of rows or non-NULL values against a specific field | Any field |
|
| Date Part | Returns a portion of the provided date as specified in the formula | A field containing date data |
|
| Divide | Returns the result of two or more numeric values divided | At least two fields containing numeric data |
|
| Floor | Returns the nearest integer less than or equal to the provided numeric field | A field containing numeric data |
|
| Max | Returns the maximum value of a field where there are multiple rows for a single record | A field containing numeric data |
|
| Min | Returns the minimum value of a field where there are multiple rows for a single record | A field containing numeric data |
|
| Modulo | Returns the remainder of the first field divided by the second field | Two fields containing numeric data |
|
| Multiply | Returns the result of two numeric values multiplied together | Two fields containing numeric data |
|
| Parenthesis | Inserts parentheses into a formula to specify order of operations in mathematical formulas | Any field |
|
| Power | Returns the result of the first field in the formula raised to the power of the second field in the formula | Two fields containing numeric data |
|
| Root | Returns the root of the first field provided in the formula where the second field determines the type of root (Square, Cubed, etc.) | Two fields containing numeric data |
|
| Round | Returns a rounded numeric result with the number of digits rounded to based on the second field or number provided | One Field containing numeric data and a whole number |
|
| Subtract | Returns the result of two numbers subtracted from each other | Two fields containing numeric data |
|
| Sum | Returns a single row with the sum of the supplied field | A field containing numeric data |
|
| Truncate | Returns a decimal numeric value as an un-rounded whole number | A field containing decimal numeric data |
|
| Zero | Returns the value of the field or "0" if the field is blank | Any field |
|


Step 6: "Conditional Fields"
The Conditional Fields step allows you to build out logic statements to customize the data that displays in the dataset. There are two ways to build a conditional field: Simple and Advanced.
Simple
The Simple conditional field is used to check the value of a single field and output a value that is determined by the contents of the value of that field. For example, I could set up a conditional field to display a field in the dataset that either displays "Yes" or "No" based on whether or not the application is approved. I could set it up so that if the "statusname" field is equal to "Approved", it will output "Yes" for that record and if it is equal to anything else, it will output to "No".

| appid | Status Name | Yes or No |
|---|---|---|
| 123 | Approved | Yes |
| 321 | Canceled | No |
| 456 | Pending Review | No |
| 789 | Approved | Yes |
The Simple option is used by selecting the "Simple" option to the right of the "Alias" text box. Once you make the selection, the template for the conditional field will appear.
Advanced
The Advanced option gives you more flexibility when building the conditional field. Instead of only being able to check if a field is equal to a specific value, you are able to make a variety of other comparisons. These include comparisons specific to fields with numeric data and datetime data. For example, if I wanted to create a conditional field that outputs a specific value depending on whether or not a date is before or after a specific date, this is how I could set that field up.
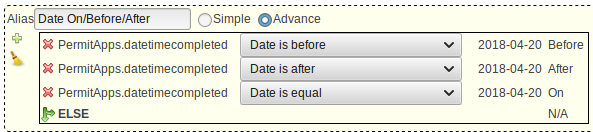
With this setup, any applications that were completed before 2018-04-20 will show "Before", any that were completed after 2018-04-20 will show "After", any that were completed on 2018-04-20 will show "On", and all other applications will return "N/A".
| appid | Datetime Completed | Date On/Before/After |
|---|---|---|
| 123 | 2018-01-01 09:38:00 | Before |
| 321 | 2018-04-20 15:01:00 | On |
| 456 | 2018-09-30 07:19:00 | After |
| 789 | N/A |
Step 7: "Formatting"
Map Report Links
If you are planning on creating a Map Report and want to include a link to the application, since the link builder is not available in the Map Report type, you will need to add a link column to the dataset. The link to an application follows a set formula: "https://onegov.site.com/view.php?id=###" where the ### is the UID of the application.
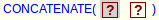
On the Formatting step, use the Concatenate operation to build the link.
The first box of the Concatenate operation will use the Manual Entry box to enter the whole link without the UID at the end (https://onegov.site.com/view.php?id=) and the second box will be the appid (Called UID on the dashabord of the site) field from the main table (PermitApps or AppValuesByTypeId/XX).
When you preview the application, you should see a column for the link that has a fully functioning link to the application in question. Try copying and pasting the link into your browser to test that it is working properly.
| Operation | Use | Requirements | Operation Format |
|---|---|---|---|
| Coalesce | Returns the value of the first field in the listing that isn't null/empty | Two or more fields |
|
| Concatenate | Returns two or more fields formatted together as one field | One or more fields |
|
| Currency | Returns a number formatted as a dollar value | A field containing a numeric value |
|
| Date Format | Returns the date provided in a format specified in the formula | A field containing date data |
|
| Date Only | Returns only the date portion of a datetime field | A field containing a date |
|
| Date Part | Returns a portion of the provided date as specified in the formula | A field containing a date |
|
| Epoch to Datetime | Returns a datetime value converted from an epoch value(the number of seconds since January 1, 1970 not counting leap seconds) | A field containing a numeric value (Must be an epoch value to function correctly) |
|
| Join | Returns a listing of values associated with a single value (Explained below) | A field and a separator value (space, comma, semi-colon, etc.) |
|
| Leftmost | Returns a number of the leftmost digits of a field as specified by the second value of the formula | Any field |
|
| Number | Returns a number field converted from a text datatype | A text field containing a number |
|
| Rightmost | Returns a number of the rightmost digits of a field as specified by the second value of the formula | Any field |
|
| Text to Date | Returns a date field converted from a text datatype | A text field containing a date |
|
| Text to Datetime | Returns a datetime field converted from a text datatype | A text field containing a date |
|


The Join Operation
The Join operation is different that the original join step in the dataset creation and is a tricky one to fully master. It requires a decent understanding of the data that you are trying to manipulate. The example below will try to explain the intricacies that come with using the Join operation using a real-life situation within OneGov.
Example: Multiple Parcels per Application
One often requested report is one that will show certain important pieces of information associated to an application. This may include the Applicant's name, the location of the work being done (parcels), and certain custom fields in the application. In some applications, the application is able to select multiple parcels on a single application. If a dataset was created to show the appid and the parcel number for that application by choosing the appid and parcel columns on the field step, there would be multiple rows that have the same appid but different parcels. This could possibly throw off the report if you were counting the number of rows to see how many applications there are in the report.
| appid | Parcel Number |
|---|---|
| 123 | 123456789 |
| 123 | 987654321 |
| 456 | 321987654 |
This problem can be solved by using the join function. Instead of choosing both the appid and parcel number on the field step, only the appid would be chosen. On the "Formatting" step, a join operation would be added by naming the field appropriately (in this case "Parcel Number") and then choosing the parcel number column and adding that to the first box in the formula and inserting a comma with a space after (so the parcels are separated a bit) in the second box using the manual input. This operation is then added to the dataset by clicking the green plus on the left side of the field builder.


By setting up the dataset in this manner, the results now show that there were only two applications and not three.
| appid | Parcel Number |
|---|---|
| 123 | 123456789, 987654321 |
| 456 | 321987654 |
Step 8: "Filter"
This step allows you to filter out more information from the dataset. You can create a filter by choosing a field from the tables that you included in the dataset in step 2. Once you click on one of the field names, it will appear in the space below the listing of tables. A drop down next to the field name will allow you to choose from several different ways to filter the dataset based on the data type of the field you chose. Once you choose how to filter the field, you can type a value into the text box to filter on that value. Once the filter is built, you can click the green plus in the top left of the filter box to add the filter to the dataset. If you accidentally click the wrong field to filter on, you can click the broom icon in the top left to clear the selection. The filter step allows you to include multiple fields in a single filter as well.
Example 1: Filter out all applications where the status is not "Approved"
- Choose the "statusname" field from the appstatus table
- Set the drop down to "Value is equal"
- Type "Approved" into the text box next to the drop down
- Click the green plus sign in the top left below the listed tables
Example 2: Filter out all applications submitted after a certain date and all applications where the approval date is blank (the application hasn't been approved)
- Choose the "datetimecompleted" and the "datetimeapproved" fields from the PermitApps table
- Set the "datetimecompleted" drop down to "Date is before" and the "datetimeapproved" drop down to "Value is blank"
- Type a date into the text box next to the "datetimecompleted" drop down and a 0 (zero) into the text box next to the "datetimeapproved" drop down
- When making a filter where you are using the "Value is blank" or "Value is not blank", you must still enter a value into the text box so you can use a zero to fill that requirement.
- Leave the "AND/OR" choice on the far left to "AND" since we can the filter to exclude both applications submitted after a certain date AND applications that have not been approved yet
- Click the green plus sign in the top left below the listed tables
Step 9: "Preview"
Click "Finish" to Save and exit from the dataset creation.
Related articles